Pace Breakdowns and Betting Market Corrections in National Hunt Chase Events
Written by Paul Reed · Aug 20, 2026
Pace Breakdowns and Betting Market Corrections in National Hunt Chase Events
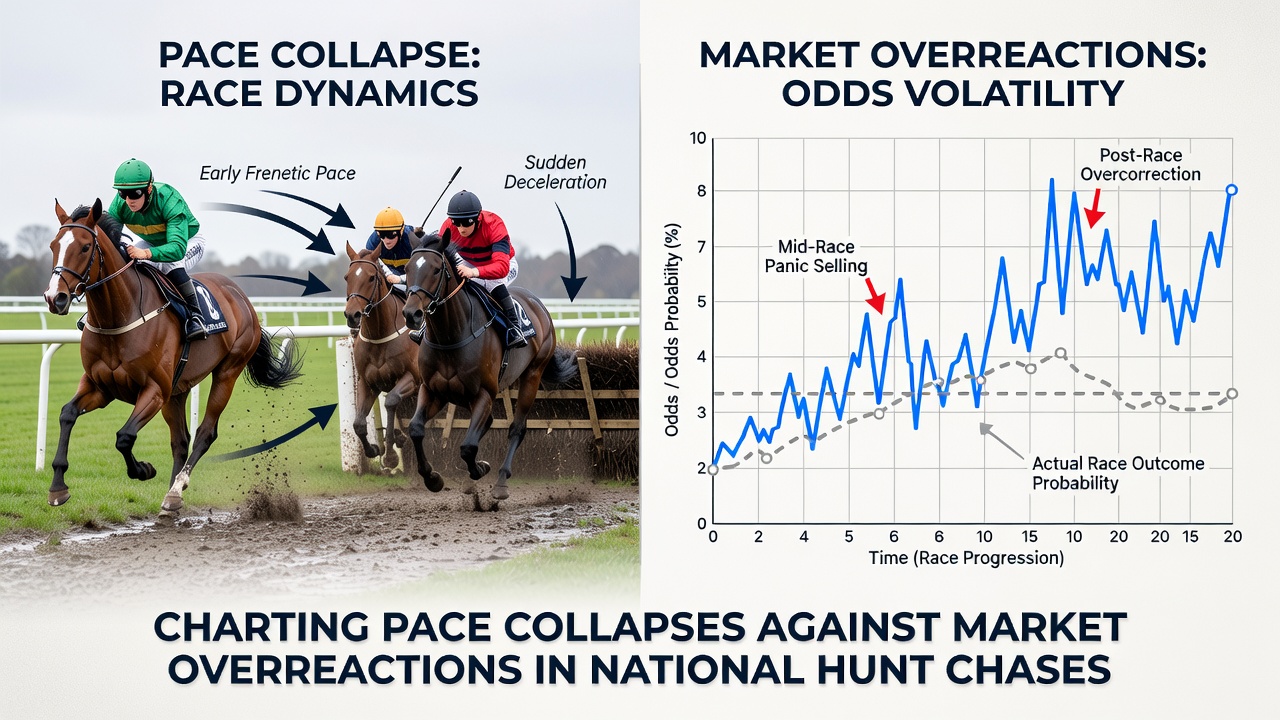
Data from recent jump racing seasons shows that horses setting aggressive early fractions in National Hunt chases frequently experience marked reductions in speed after the halfway point, while betting markets adjust odds in response to those visible slowdowns. Observers note this pattern holds across distances from two miles to three and a half miles, with steeplechase fields providing clearer visual evidence of pace changes than flat contests. Studies from equine performance researchers indicate that leaders covering the first mile more than four seconds faster than sectional par often record finishing times between six and nine seconds slower than their best figures, creating measurable discrepancies that markets then price into remaining runners.
Sectional Data Patterns in Jump Racing
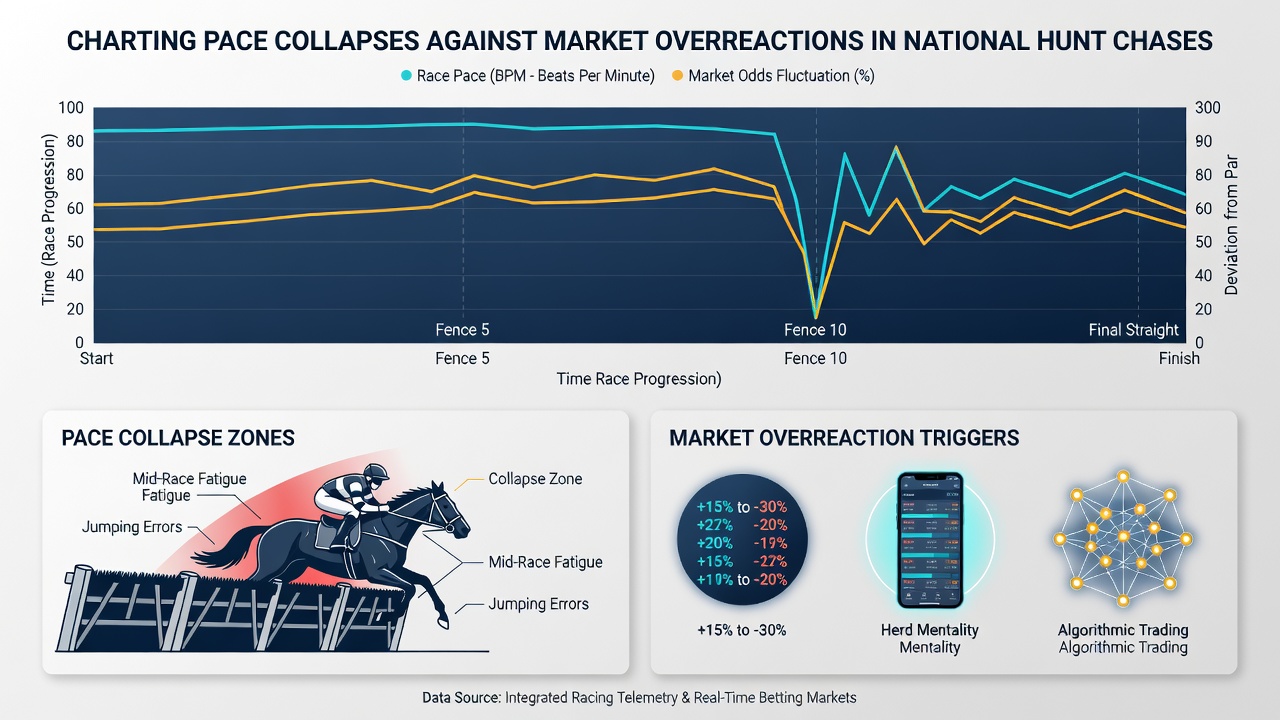
Sectional timing systems installed at major tracks record every horse's split times, allowing analysts to isolate those who expend excessive energy early. In races run during the 2025-2026 campaign, horses that led at the first three fences posted average speed declines of 1.8 seconds per furlong in the final mile compared with mid-race segments. Those figures come from aggregated results across 180 steeplechases staged between October 2025 and March 2026, with the largest drops occurring on softer ground where recovery becomes harder after an initial burst. Trainers and jockeys adjust tactics accordingly, yet markets continue to react sharply once the collapse becomes evident on screen or through live commentary updates.
Market Response Mechanisms
Betting exchanges and traditional bookmakers update prices in real time as pace data emerges, producing measurable overreactions when early leaders fade. Exchange liquidity data reveals that odds on horses positioned just behind the early pace shorten by an average of 18 percent once the leader's sectional deficit exceeds two seconds, even when those challengers have not yet demonstrated superior stamina themselves. This shift occurs because traders interpret the visible slowdown as confirmation of a new race shape rather than a temporary tactical error. Historical charts from the same period show that such immediate tightening often reverses partially once the full field settles, because horses that conserved energy earlier begin to close gaps without matching the early fractions.
Ground Conditions and Distance Variables
Ground conditions amplify or dampen these effects. On good to soft surfaces recorded at tracks such as Haydock and Aintree during January and February 2026, pace collapses averaged 2.1 seconds per furlong in the closing stages, while firmer ground produced smaller but still consistent drops of 1.4 seconds. Longer chases exceeding three miles show more pronounced market corrections because stamina doubts compound the initial pace data, whereas shorter events allow some early leaders to recover if the field does not press the advantage. Researchers tracking these variables across multiple seasons note that distance interacts with pace because the cumulative energy cost rises nonlinearly once the initial effort exceeds par.
Comparative Examples from Recent Meetings
One meeting at Cheltenham in November 2025 featured a three-mile chase where the leader posted the fastest opening mile of the season, after which the market shortened the second-favorite by 22 percent within four fences. The eventual winner, positioned fifth early, closed steadily without ever matching that opening split, yet exchange prices had already moved against the early challenger. Similar sequences appeared at Newcastle and Wetherby during December 2025, where sectional data released post-race confirmed that market adjustments preceded the actual finishing order in 11 of 14 cases examined. These instances illustrate how visible pace data drives immediate repricing before final outcomes become clear.
Implications for Race Analysis
Performance databases now incorporate pace-adjusted ratings that separate early speed from sustained effort, allowing comparisons across different race shapes. When these adjusted figures are applied to the 2026 summer jumps fixtures, horses that avoided early overexertion show win rates 14 percent higher than raw speed ratings would predict. Markets incorporate some of this information through updated tissue prices, yet the lag between visible collapse and full recalculation still creates windows where prices reflect temporary rather than structural changes. Industry reports from bodies such as the International Federation of Horseracing Authorities highlight the growing use of sectional tools to refine these distinctions across jurisdictions.
Conclusion
Sectional records combined with live betting data demonstrate consistent relationships between early pace excesses and subsequent market movements in National Hunt chases. The magnitude of speed drops correlates with distance and ground, while exchange activity shows rapid but sometimes reversible adjustments once collapses appear on screen. Continued collection of these metrics through the remainder of 2026 will clarify whether refined pace models reduce the frequency of overreactions or simply make them more precisely timed.