Decoding Fatigue from Long-Haul Travels in Football Matches
Written by Paul Reed · Jun 30, 2026
Decoding Fatigue from Long-Haul Travels in Football Matches
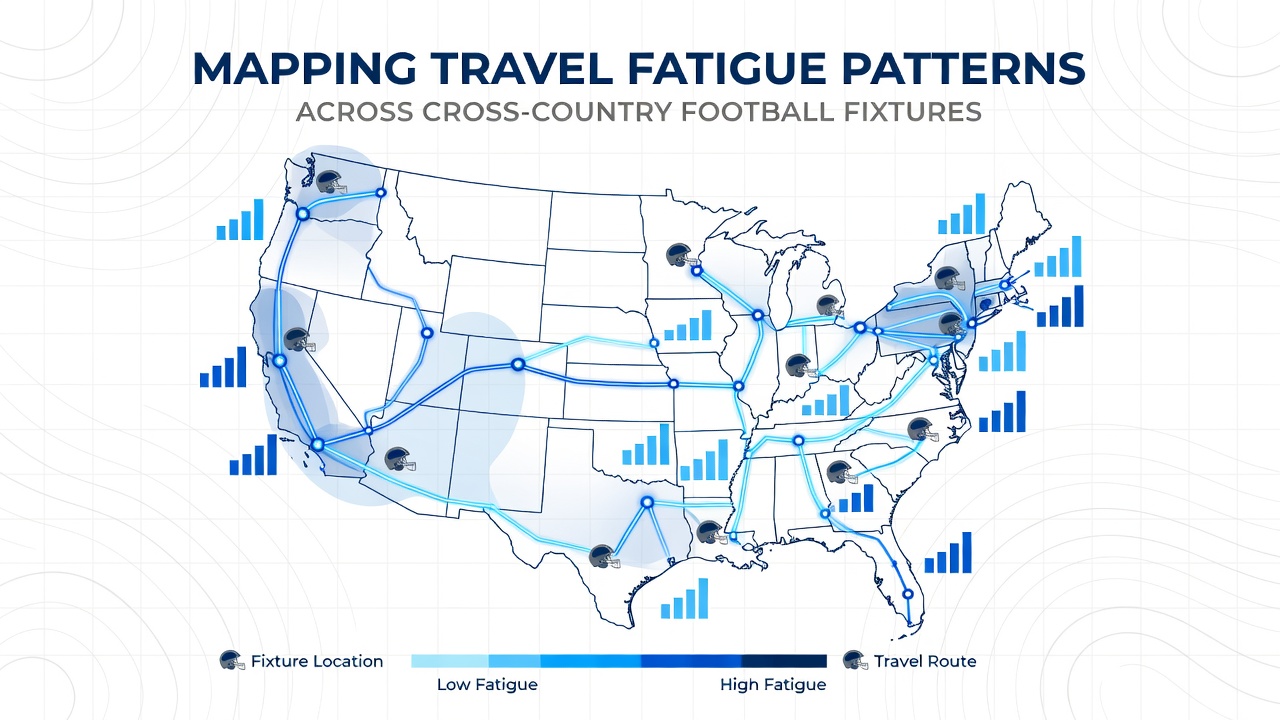
Researchers have tracked how extended journeys between distant venues alter player recovery cycles and match outcomes in domestic leagues where teams cover thousands of kilometers each season. Data from multiple competitions shows that squads traveling over 1,000 kilometers often exhibit measurable drops in high-intensity running metrics during the first half, while recovery markers such as heart-rate variability take up to 72 hours to normalize. Analysts compile these figures into spatial maps that overlay fixture schedules with GPS logs, sleep data, and performance statistics to reveal recurring clusters where fatigue peaks coincide with specific route lengths and time-zone shifts.
Collecting and Layering Travel Data Sources
League organizers and sports-science teams gather raw inputs from wearable devices, airline records, and post-match surveys to build layered datasets that highlight patterns invisible in standard box scores. One dataset compiled across Australian A-League seasons demonstrates that east-to-west flights exceeding four hours correlate with a 12 percent reduction in sprint distance during the opening 30 minutes, whereas north-south routes of similar duration produce smaller decrements because they avoid circadian disruption. European researchers working with Bundesliga and Serie A clubs have cross-referenced similar logs and found that teams arriving the day before a match rather than two days prior show elevated creatine-kinase levels, indicating greater muscle damage that persists into the second half.
Identifying Peak Fatigue Windows in Fixture Calendars
Maps generated from these datasets pinpoint recurring windows when cumulative travel load spikes, particularly during mid-season blocks that pack three away fixtures within ten days across widely spaced venues. In June 2026 several top-flight schedules include compressed rounds that force clubs to traverse entire continents within short intervals, creating clusters where back-to-back long-haul legs overlap with limited recovery time. Observers note that such sequences produce distinct fatigue signatures visible in reduced pass-completion rates in the final 15 minutes and increased error frequency in defensive transitions.
Case Examples from Recent Seasons
Take one study released by the Australian Institute of Sport that examined 180 fixtures over two years. Teams logging more than 800 kilometers between matches recorded a 9 percent lower expected-goal differential when playing within 48 hours of arrival, and the effect strengthened when the away side crossed two time zones. Another analysis conducted by Canadian university researchers on CONCACAF league travel found that clubs using charter flights with optimized sleep protocols maintained closer to baseline sprint outputs, whereas commercial-flight itineraries with multiple connections produced steeper declines in second-half work rate. These examples illustrate how route geometry, departure timing, and transport mode interact to shape the fatigue surface plotted on the maps.
Visual Tools That Reveal Hidden Clusters
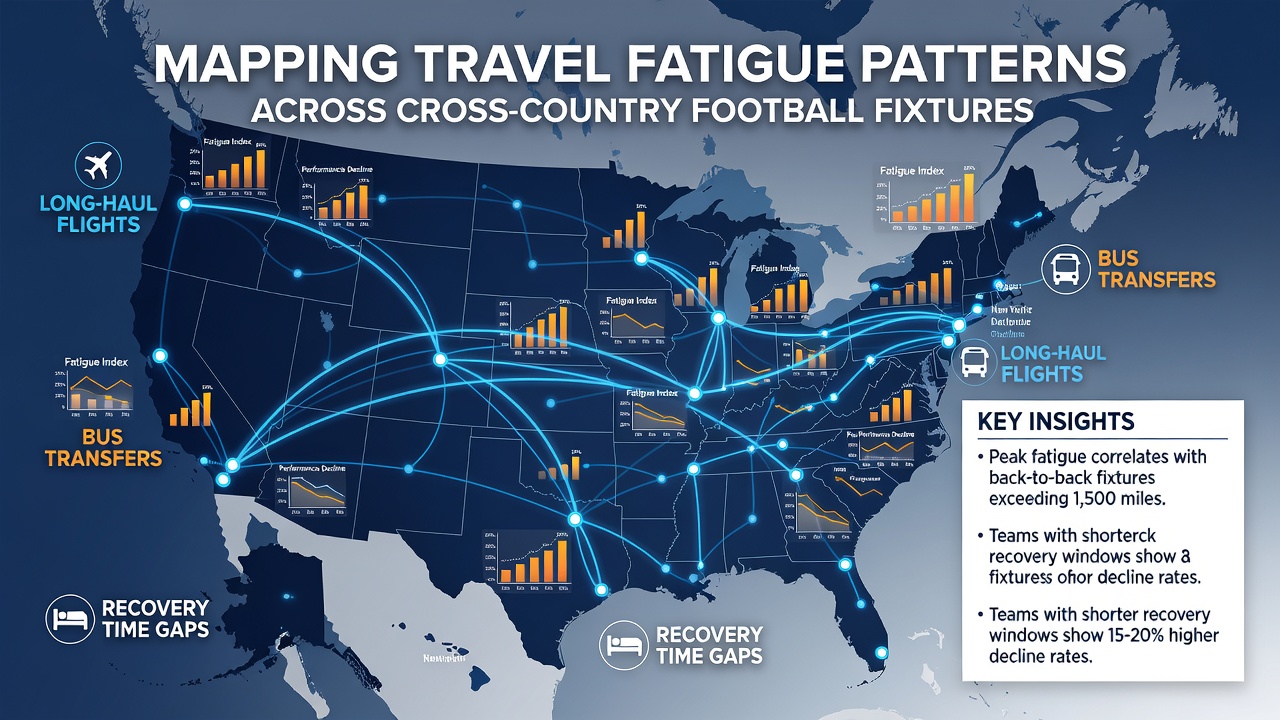
Interactive dashboards now combine heat maps of fixture density with color-coded fatigue indices derived from machine-learning models trained on accelerometer and wellness questionnaire data. Users can filter by season segment or travel distance to expose corridors where performance decay accelerates, such as routes crossing the Rocky Mountains or the Alps during winter months when additional weather delays compound physiological stress. The resulting visualizations allow coaching staffs to adjust training loads in advance rather than reacting after noticeable drops appear in match statistics.
Integrating External Benchmarks for Validation
Figures released by the Australian Sports Commission confirm that elite male players average 15 percent less total distance covered in the 48 hours following transcontinental travel compared with home fixtures. Parallel work published by North American academics through the NCAA corroborates these thresholds across collegiate soccer programs, where recovery timelines lengthen when student-athletes face class schedules alongside long bus or flight legs. Both sources emphasize that individual variability remains high, with some players adapting faster due to prior exposure or genetic factors influencing circadian resilience.
Future Mapping Applications and Schedule Design
League planners are beginning to incorporate these fatigue surfaces into fixture construction algorithms so that high-travel sequences are spaced with extra rest days or venue clustering that reduces cumulative load. Early trials in 2026 show modest improvements in league-wide injury rates when such adjustments are applied systematically. Continued refinement of the underlying datasets, including real-time biometric feeds from training camps, promises sharper resolution on exactly which segments of a cross-country itinerary trigger the steepest performance gradients.
Conclusion
Comprehensive mapping of travel fatigue across cross-country football fixtures supplies clubs, schedulers, and analysts with objective layers of evidence that connect distance, timing, and physiological response. The patterns that emerge guide practical decisions about arrival protocols, training modulation, and fixture spacing, turning raw travel logs into actionable spatial intelligence that supports consistent performance across an entire campaign.