Charting Jet Lag Effects on Competitor Readiness Across Global Events
Written by Sage Klein · Jun 20, 2026
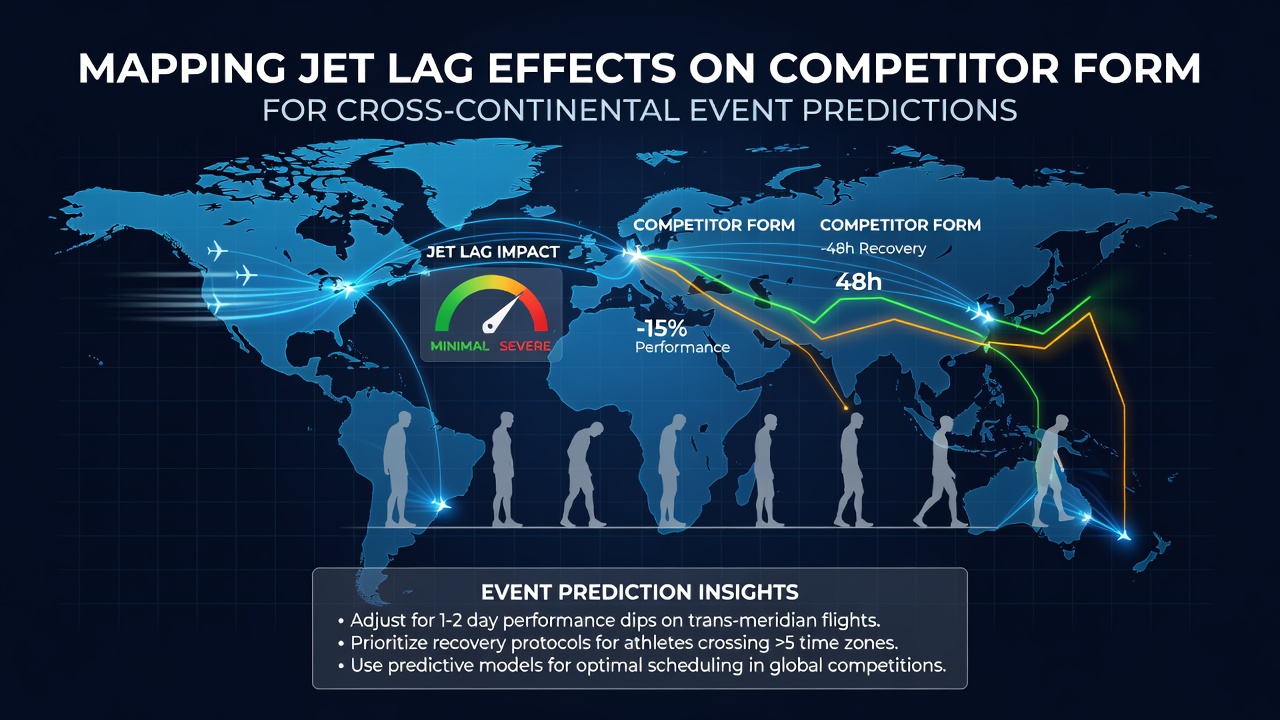
Charting Jet Lag Effects on Competitor Readiness Across Global Events
Jet lag arises when rapid travel across multiple time zones disrupts the body's internal clock, and researchers have documented measurable declines in reaction time, endurance, and decision-making among athletes who cross continents for major events. Studies tracking circadian misalignment show that eastward flights often produce stronger disruptions than westward ones because the body struggles more to advance its sleep-wake cycle than to delay it.
Performance data collected from tennis players, marathon runners, and team-sport athletes reveal consistent patterns where symptoms peak between 48 and 72 hours after arrival, with partial adaptation occurring over subsequent days depending on the number of time zones crossed and individual chronotype.
Biological Mechanisms Behind Performance Dips
The suprachiasmatic nucleus in the hypothalamus governs daily rhythms of hormone release, core body temperature, and alertness, yet abrupt shifts leave melatonin secretion and cortisol peaks misaligned with local time. Athletes who depart from their home base in the evening and arrive at dawn local time frequently experience fragmented sleep on the first two nights, which compounds into reduced glycogen replenishment and slower neuromuscular recovery.
Researchers at the Australian Institute of Sport have recorded that athletes traveling more than five time zones eastward show average drops of 4 to 7 percent in repeated-sprint ability during the initial 72 hours, while those traveling westward exhibit smaller but still detectable reductions in fine motor control and tactical processing speed.
Data Collection Methods for Mapping Effects
Modern mapping relies on wearable devices that log sleep architecture, heart-rate variability, and daily activity alongside competition results, allowing analysts to build regression models that predict performance decrements based on travel vectors and recovery windows. Longitudinal datasets from Olympic cycles demonstrate that teams which schedule structured light-exposure protocols and targeted napping recover baseline metrics 24 to 36 hours faster than those relying on unstructured rest alone.
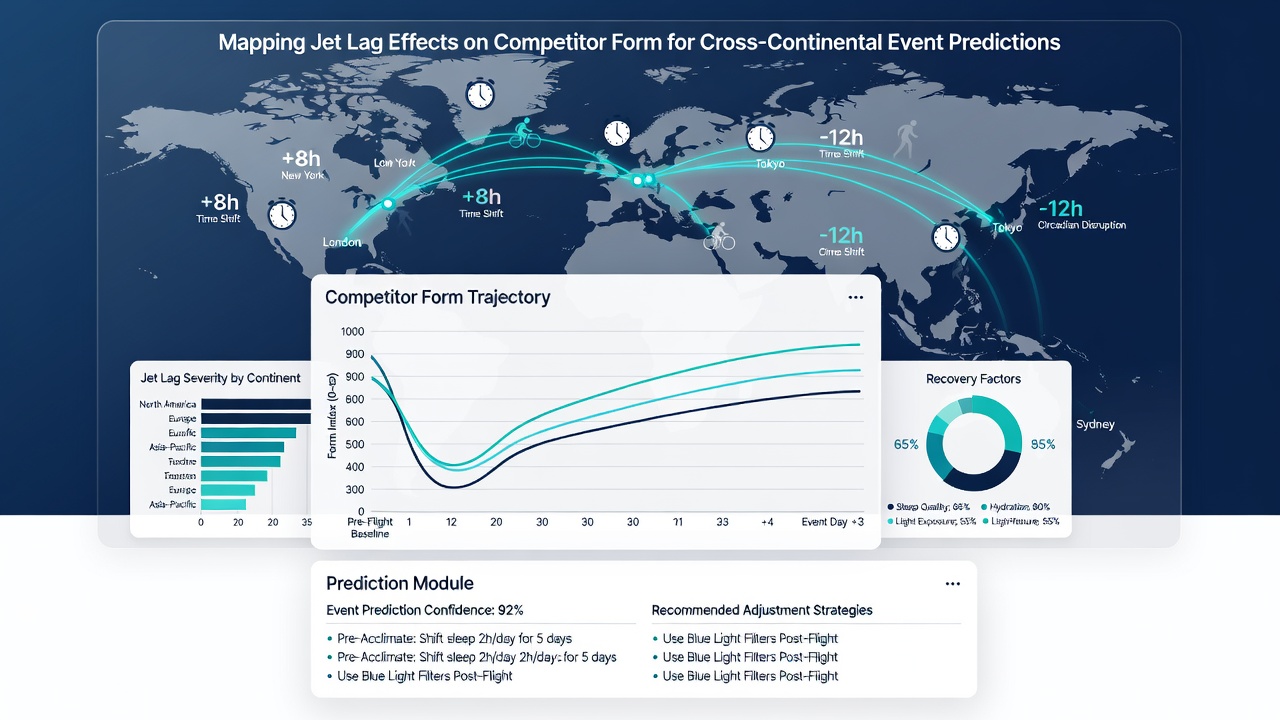
One study published in the Journal of Sleep Research examined 312 elite competitors across three Summer Olympics and found that the probability of reaching personal-best marks declined by roughly 11 percent when events occurred within four days of a six-plus-zone eastward crossing, yet the same cohort returned to expected output levels once seven full days had elapsed.
Applications in Event Forecasting
Prediction frameworks now integrate jet-lag coefficients alongside traditional form indicators, adjusting expected win probabilities for athletes whose schedules include long-haul flights immediately before key matches. In tennis, for example, players arriving in Melbourne from Europe in January have historically posted first-week win rates approximately 9 percent below their season averages, a gap that narrows once acclimatization exceeds five nights.
Similar adjustments appear in team sports when clubs cross the Atlantic for mid-season tournaments. Data compiled by the NBA shows visiting European-based squads in June exhibition games record defensive efficiency metrics that lag behind season norms by 6 to 8 points per 100 possessions during the opening two contests, after which performance stabilizes.
June 2026 Context and Ongoing Research
With the FIFA World Cup scheduled for June and July 2026 across North American venues, national federations have begun modeling travel itineraries that minimize cumulative time-zone exposure for squads drawn from South America, Africa, and Asia. Preliminary simulations released by the Union of European Football Associations indicate that European teams flying westward across seven to nine zones could face measurable disadvantages in opening-group fixtures if recovery periods fall short of 96 hours.
Academic groups continue refining algorithms that combine flight logs, venue latitude, and historical performance residuals to generate individualized risk scores, thereby supplying event organizers and analysts with quantitative inputs rather than anecdotal estimates.
Conclusion
Comprehensive mapping of jet-lag effects supplies a factual layer to cross-continental event predictions by quantifying how circadian disruption translates into measurable performance variance. Continued accumulation of biometric and outcome data will allow models to incorporate additional variables such as age, prior travel load, and chronotype, refining forecasts for future global competitions.